
Harness the Power of Data Analytics to Manage Rising Healthcare Costs
With healthcare costs skyrocketing and employers and employees grappling with increasing deductibles and copays, understanding and leveraging data analytics in benefit planning is essential.
Over the last decade, wages have increased by 54% while healthcare costs have increased by a staggering 230%. To put this into perspective, for every dollar of an employee’s paycheck, 37 cents go toward healthcare. Additionally, hospital prices increased by 80%, significantly more than premium or pharmacy costs. These statistics underscore the need for employers to dig deep into healthcare spending patterns, identify areas for optimization, and empower their workforce to be smarter healthcare consumers.
Cora Opsahl, director of the 32BJ Health Fund, emphasized the pivotal role of data analytics in shaping health benefit plans at The Alliance’s 2024 Spring Symposium. The 32BJ Health Fund is a self-funded plan providing affordable, comprehensive, innovative coverage to 200,000 union members and their families. The 32BJ Health Fund is a powerful example of the transformative power of data-driven decision-making to manage healthcare costs while improving benefits. Using insights from data analytics, Cora has implemented changes for the 32BJ Health Fund that saved more than $35 million in 2022. Changes included removing the New York-Presbyterian hospital system and physicians from the network and transitioning to a new pharmacy vendor and pharmacy group purchasing coalition.
Keep reading to get the most important insights from Cora’s presentation. You can also register for our 2024 Spring Symposium webcast to watch this session, and other sessions from the in-person event on demand.
Why Care About Data?
The Consolidated Appropriations Act of 2021 (CAA) codified employers’ right to access their healthcare data and formalized their fiduciary responsibility. Employers are required to be good stewards of their benefit plans. If they are not, they can be sued for mismanaging the plan.
Not only do employers have a right to see their data, but under the Transparency in Coverage (TiC) rule, they have a right to know their data. This means employers have a right to know what they are paying for healthcare. They also have a right to know how it compares to what others are paying for the same services.
Data analytics help employers understand where their healthcare dollars are being spent. For example, prices for certain procedures vary greatly between providers, especially “shoppable” services like colonoscopies, imaging services, carpal tunnel surgeries, and orthopedic services such as knee, hip, and shoulder surgeries. By using data analytics, employers can see where their plan participants are going for these services and where they could go instead to save the plan money. Employers can then educate their employees on the best sites of service for different kinds of care – known as steering.
How to Leverage Data?
When it comes to data analytics, Cora recommends starting with the basics. You can dig deeper as you gain an understanding of what you’re looking at and how to apply those insights. Start by using internal resources. Then, you may want to consider hiring a data analyst or working with a consultant like The Alliance.
Data 101
The first level of data analytics is to understand the who, what, where, and how of the claims data.
- How much are you spending?
- Where are you spending?
- What services are you spending on?
With these answers, you can steer employees to providers and service locations that provide good care at lower prices. Site of service steering is effective and relatively straightforward to implement.
First, make sure employees know to use their primary care provider (PCP) for non-urgent health concerns. Their next step should be to use urgent care before seeking ER services. If the patient needs surgery, they can consider an ambulatory surgical center (ASC), which has lower costs than hospital services. If that is not possible, they can try outpatient surgery and, finally, inpatient.
Inpatient and outpatient hospital costs account for 44% of the average employer’s healthcare spending. So, directing employees to the appropriate site of care can make a big difference. By leveraging data analytics, employers can identify high-cost providers, educate employees on cost-effective healthcare options, and ultimately drive down healthcare spending. This is a win-win because employees and their families save money on healthcare, and they save the plan money, which translates into stable or lower premiums and better benefits.
Data 201
After you understand where your most expensive claims are coming from, you can dive deeper into your cost trends over time. To find cost drivers, you can analyze the data by disease state, drug, or health system. When you know your main cost drivers, you can make decisions about how to reduce or eliminate these costs. This may mean implementing a care advisor, identifying and steering away from low-value providers and systems, or further incentivizing patients by offering free healthcare at preferred-value providers.
Data 301
Finally, you can perform a more complex data analysis to see what factors are impacting your spending trend. Then, you can use these insights to create a plan design that can facilitates savings and improves plan participants’ lives. You can also use the information from your analysis to evaluate your current health benefit vendors. You can read more about how to choose effective benefit partners here.
Transparency Tools
Below are a few tools you can use to make more informed decisions for your benefit plan.
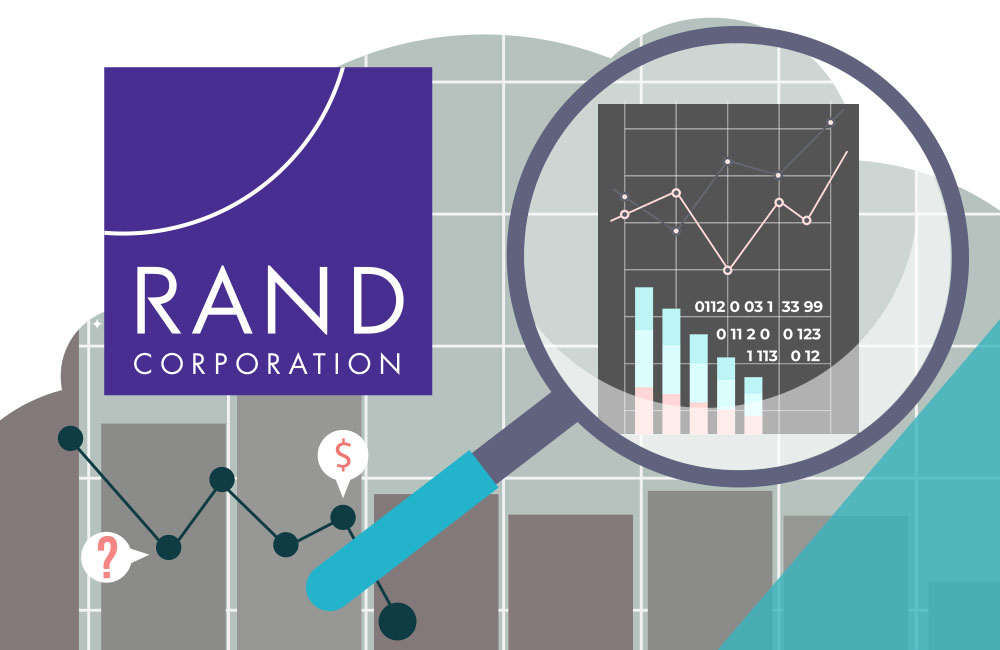
RAND Hospital Price Transparency Study
RAND Corporation aggregates data from self-funded employers who chose to participate in RAND’s Hospital Price Transparency Study, state employee health plans, and All-Payer Claims Databases (APCDs). The RAND study calculates the rough estimate of savings if employers were to pay Medicare prices for healthcare.
NASHP Hospital Cost Calculator
The National Academy for State Health Policy (NASHP) tool leverages CMS Medicare Cost Reports and hospital and state median breakeven prices to determine hospital efficiency. It can compare the Net Profit Margin to Charity Care as a percentage of Net Patient Revenue.
Turquoise Health Data
Turquoise Health is a clearinghouse for hospital pricing data. This data allows you to compare your contracted rates to the market. It also enables provider price analysis with machine-readable files (MRFs). Note that there is a fee to access Turquoise Health’s data.
Sage Transparency Tool
The Sage Transparency tool, created by the Employers’ Forum of Indiana, leverages data from RAND, NASHP, Centers for Medicare and Medicaid Services (CMS), Quantros, and Turquoise Health to compare hospital prices to Medicare prices and to one another. This free tool encompasses the functionality of the previous tools. It uses quality data from Quantros and CMS to compare price to quality.
Building Trust through Transparency
As the Dalai Lama aptly said, “Lack of transparency results in distrust and a deep sense of insecurity.” Embracing data analytics in benefit planning is necessary to rebuild trust and drive meaningful change in healthcare. By empowering employers with actionable insights and fostering a culture of transparency, we can pave the way for a healthcare system that is not only more affordable but also more equitable and sustainable.
Analyzing your data is challenging, but if you commit, it can make a huge difference in your benefit plan. We’re hosting three data workshops this summer in which we’ll help you make sense of your data in real time. Learn more about these hands-on workshops here. Save your spot to transform your benefit plan for your business and your employees.
Related Posts


Ryan Peterson
Director of Analytics
Ryan Peterson joined The Alliance in 2013 as senior analyst/programmer of value measurement transformation and was promoted to director of analytics in 2022. Ryan leads the teams responsible for the development and maintenance of operational software, dashboards, automation, and analytic packages, which guides our employer-members’ benefit strategies and helps them receive more value from their healthcare. Before joining The Alliance, Ryan led technical services at Epic in Madison and was the senior staff engineer for Johns Hopkins University Applied Physics Laboratory.
See More Posts